How to Connect Adtraction to Google Sheets for Affiliate Reporting
I built an n8n workflow that pulls Adtraction affiliate stats into Google Sheets in 40 minutes. Exact v3 API config, rate limit handling, and scheduling.

Edward Chalupa
Founder, Whtnxt · Dallas, TX

I manage affiliate programs for a Dallas ecommerce client that runs four campaigns through Adtraction. For the first quarter I opened the Adtraction dashboard every Monday, exported the previous week as a CSV, and reformatted it by hand. That routine cost me about 45 minutes a week, roughly 35 hours a year of copy-paste work that added zero insight.
Adtraction has a v3 reporting API that returns everything the dashboard shows, and it is simple enough to wire into Google Sheets with n8n in under an hour. I built the connector, scheduled it for 6 AM daily, and the affiliate numbers now land in a live sheet before I pour coffee. Here is the exact setup, including the rate limit gotchas that tripped me up on the first build.
What You’re Building
A scheduled n8n workflow that authenticates against the Adtraction v3 API with an API token, queries the Statistics by Day endpoint for the previous 7 days, transforms the JSON response into flat rows, and appends them to a Google Sheet. The result is a running daily log of clicks, commissions, and order values per program that you can chart, pivot, or feed into a Looker Studio dashboard.
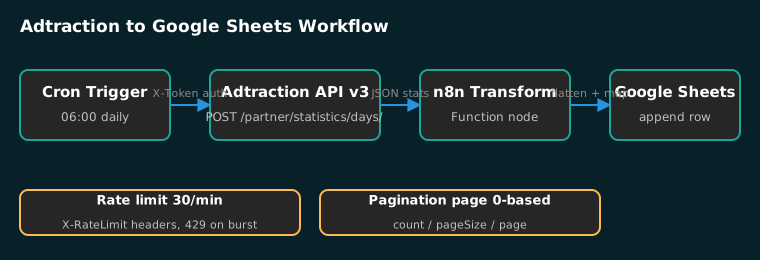
The key design decision: use the Statistics by Day endpoint (POST /partner/statistics/days/) rather than the raw Transactions endpoint. Statistics by Day returns pre-aggregated totals per day, so a 30-day pull is 30 rows, not thousands of transaction records. That keeps the sheet small, the workflow fast, and the rate limit usage low.
Info: The Adtraction API runs on a quota system. Most endpoints allow 30 requests per minute, a few allow only 10. A daily stats pull is one request per day range, so you stay far inside the quota. The limit only bites if you loop over every program and channel individually.
What You’ll Need
| Item | Details | Time to Set Up |
|---|---|---|
| Adtraction account | Partner account with at least one active program | Already done |
| API token | Account > Settings > API tab > Create new API token | 3 minutes |
| n8n instance | Self-hosted or cloud (I run n8n on a $12/month VPS) | 30 minutes |
| Google Sheet | Empty sheet for the reporting data | 2 minutes |
| Google Sheets API credentials | Service account with edit access to the sheet | 10 minutes |
Total setup from scratch: about 90 minutes. If n8n is already running with a Google Sheets credential, this takes under 40. If you are new to n8n entirely, my n8n marketing automation engine setup walks through the base install and credential vault first. This is the same architecture I use in client marketing automation work, just scoped to one reporting pipe.
How Do You Get an Adtraction API Token?
Log into your Adtraction account, open Account > Settings, and click the API tab. Click “Create new API token”, copy the value, and store it in your n8n credentials vault. The token is a single static key, which is a welcome change from the Outbrain API I documented in my Outbrain to Google Sheets connector guide: no 24-hour expiry, no login endpoint, no refresh dance.
Adtraction authenticates with an X-Token header on every request, not a bearer token in the URL. Test it with a curl call before touching n8n:
curl -X POST "https://api.adtraction.net/v3/partner/statistics/" \
  -H "X-Token: YOUR_API_TOKEN" \
  -H "Content-Type: application/json" \
  -H "Accept: application/json" \
  -d '{
    "fromDate": "2026-08-07",
    "toDate": "2026-08-13",
    "currency": "USD",
    "market": "US",
    "transactionStatus": 3
  }'
A 200 OK returns the aggregated statistics JSON. A 401 means the token is wrong or lacks partner permissions. A 405 means you used the wrong HTTP method; the statistics endpoints are strictly POST. The full endpoint reference lives in the Adtraction API v3 documentation{target=“_blank”}, and the official getting-started guide{target=“_blank”} covers token creation and API limits.
Warning: The
transactionStatusfield is a number, not a string.1= approved,2= pending,3= approved + pending,4= open claims,5= rejected. I used"approved"as a string on my first attempt and got a400 Bad requestwith a validation error. Use3to include approved and pending, which matches what the dashboard shows by default.
How Do You Set Up the Destination Sheet?
Create a new Google Sheet and name it something like “Adtraction Daily Performance”. The header row needs these columns:
| Column | Field | Source API Property |
|---|---|---|
| A | Date | date |
| B | Program ID | programId |
| C | Program Name | programName |
| D | Impressions | impressions |
| E | Clicks | clicks |
| F | Unique Clicks | clicksUnique |
| G | Commissions | commission |
| H | Order Value | orderValue |
| I | Leads | leads |
| J | Sales | sales |
| K | EPC | epc |
| L | Conversion Ratio | conversionRatio |
Share the sheet with your Google service account email and give it Editor access. n8n’s Google Sheets node needs write permission to append rows. I keep the service account scoped to just this sheet, not the whole Drive. The Google Sheets API docs{target=“_blank”} explain the service account flow if you have not set one up before.
One field worth knowing before the first pull: EPC is Earnings Per Click, computed by Adtraction as commission divided by unique clicks. It is the single best health check for an affiliate program because it ties traffic quality to payout. Watch it per program, not just in the rolled-up total.
How Do You Build the n8n Statistics Workflow?
The workflow is four nodes: a Schedule Trigger, an HTTP Request node, a Function node, and a Google Sheets node. It follows the same shape as the automated marketing reporting dashboard I built for GA4 and Search Console, with the auth swapped for Adtraction’s token header.
Step 1: Schedule Trigger
Set the trigger to run daily at 6 AM Central:
{
  "rule": {
    "interval": [
      {
        "field": "hours",
        "hoursInterval": 24
      }
    ],
    "triggerAtHour": 6,
    "triggerAtMinute": 0
  }
}
Adtraction reports on Stockholm time (UTC+2 in summer), so pulling at 6 AM Central means the previous full day has settled. If you pull at midnight Central, the tail of the European day may still be processing and you will miss late conversions.
Step 2: HTTP Request Node
Configure the HTTP Request node to hit the Statistics by Day endpoint:
{
  "method": "POST",
  "url": "https://api.adtraction.net/v3/partner/statistics/days/",
  "authentication": "genericCredentialType",
  "genericAuthType": "httpHeaderAuth",
  "sendHeaders": true,
  "headerParameters": {
    "parameters": [
      {
        "name": "X-Token",
        "value": "={{$credentials.adtractionToken}}"
      }
    ]
  },
  "sendBody": true,
  "contentType": "json",
  "jsonBody": "={{ {\"fromDate\": $now.minus({days: 7}).toFormat('yyyy-MM-dd'), \"toDate\": $now.minus({days: 1}).toFormat('yyyy-MM-dd'), \"currency\": \"USD\", \"market\": \"US\", \"transactionStatus\": 3} }}"
}
Use an expression for the date range so the workflow always pulls the trailing 7 days ending yesterday. Hardcoding dates means the sheet silently goes stale the moment you forget to edit the workflow.

Step 3: Function Node
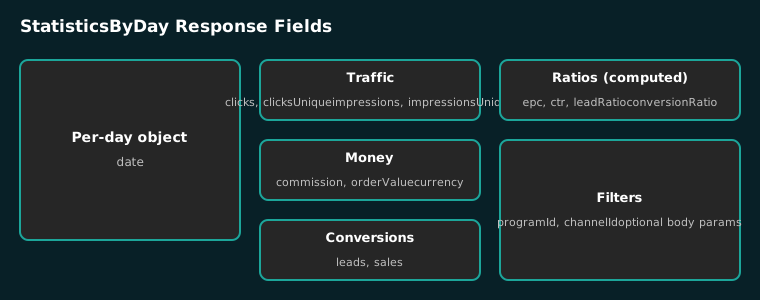
The Statistics by Day response is an array of objects with the fields from the table above. The Google Sheets node needs a flat object per row, so the Function node maps the response:
const stats = $input.first().json;
const rows = stats.map(s => ({
  date: s.date.slice(0, 10),
  programId: s.programId || '',
  programName: s.programName || '',
  impressions: s.impressions || 0,
  clicks: s.clicks || 0,
  clicksUnique: s.clicksUnique || 0,
  commission: s.commission || 0,
  orderValue: s.orderValue || 0,
  leads: s.leads || 0,
  sales: s.sales || 0,
  epc: s.epc || 0,
  conversionRatio: s.conversionRatio || 0
}));
return rows;
I truncate the ISO timestamp to the date portion with slice(0, 10) and default every numeric field to 0 so the sheet never gets null cells that break charts.
Step 4: Google Sheets Node
Point the Google Sheets node at your destination sheet, select “Append or update row”, map the Function node’s output to columns A-L, and run the workflow manually once to confirm rows land. After the test run, delete the test rows before the first scheduled execution, otherwise you will double-count day one.
How Do You Transform and Append the Data?
The Function node above covers the simple case. If you manage multiple programs, you will want the by-program breakdown instead of the rolled-up total. Switch the endpoint to POST /partner/statistics/programs/ and the response comes back grouped per program, which is what feeds the per-program rows in the sheet. The response object shape is identical for every statistics sub-endpoint, so the mapping logic does not change.
For deduplication, add a check before append: query the sheet for the max date already present, and only append rows where date is newer. Without this, a manual re-run of the workflow stacks duplicate rows for the same day. I learned this the hard way when I re-ran the workflow to test a tweak and ended up with three copies of last week in the sheet.
// Dedup guard: skip days already in the sheet
const existing = $input.all()[0].json.rows || [];
const existingDates = new Set(existing.map(r => r.date.slice(0, 10)));
const fresh = $json.filter(r => !existingDates.has(r.date));
return fresh;
What Pitfalls Did I Hit?
Three issues cost me real time on the first build, and all three are documented in the Adtraction API reference if you know where to look.
Pagination starts at page 0. The v3 API returns count, pageSize, and page on paginated endpoints, and the first page is 0, not 1. My first loop requested page 1 and got an empty set while the data sat on page 0. For the daily stats pull this rarely matters because 7 days of one program is a single page, but the transaction and click endpoints paginate hard.
Rate limits return 429, not 403. When you exceed the per-minute quota, the API answers with 429 Too Many Requests and headers that tell you when the window resets: X-RateLimit-Limit, X-RateLimit-Remaining, and X-RateLimit-Reset. The fix is to read the reset timestamp and wait, not to retry blindly. n8n’s HTTP node has a built-in retry-on-fail option; set it to retry on 429 with a 60 second wait.
The API reports Stockholm time. Every date in the response is ISO 8601 in UTC, but the tracking server sits on Stockholm time. A conversion that happens at 11 PM Central on August 13 is recorded as August 14 Stockholm time, and if you pull “yesterday” by your local calendar you will see it land under the next day’s date. I pull 7 days with a 2 day offset buffer to absorb the timezone delta, and I filter client-facing reports by the local date in the sheet, not by the API’s date.
Tip: Keep the API token out of workflow code entirely. Store it as an n8n credential (
httpHeaderAuth) and reference it with$credentials. The Adtraction help center is explicit that tokens must be handled with care, and once a token is committed to a repo or pasted into a workflow export, it is compromised.
When Should You Use This Instead of a Paid Connector?
Supermetrics, Zapier, and Portable all sell Adtraction-to-Sheets connectors, and the top results for this query are those product pages. Here is the honest cost comparison:
| Option | Monthly Cost | Setup Time | What You Get |
|---|---|---|---|
| n8n + Adtraction API (this build) | $0 (existing n8n) | 40-90 minutes | Full control, raw fields, your schedule, no per-source fees |
| Supermetrics | ~$39/month for one destination | 10 minutes | Managed connector, many sources, weekly refresh on entry plan |
| Zapier | ~$20/month on paid plans | 15 minutes | Task-based pricing, triggers on new transactions, no aggregation |
| Portable | ~$20-50/month per source | 15 minutes | ETL-style sync, scheduled refreshes |
The paid connectors win on setup speed and multi-source consolidation. If you need 15 ad platforms in one dashboard and your time is worth more than $39 a month, buy Supermetrics and move on. The DIY build wins when you want the raw epc and conversionRatio fields that the connectors often drop, when you need a 6 AM daily schedule without paying for a higher refresh tier, or when you are already running n8n and the marginal cost is zero. My DIY marketing automation vs hiring a consultant piece goes deeper on the buy-versus-build decision for DFW businesses. If your reporting stack has more leaks than this one connector, a full automation audit will surface them faster than building connector by connector.
Info: My rule of thumb: one or two ad sources, build the connector. Five or more sources, buy the connector and spend the saved hours on analysis. The build above pays for itself in the first month you would have spent on a single-source Supermetrics plan.
What’s Next
Once the daily sheet fills up, you can also raise it into a BI report: connect Adtraction to Power BI builds on this exact sheet with a scheduled semantic-model refresh. If you would rather ask the API questions than read a dashboard, connect Adtraction to Claude Code wraps the same token and endpoints in a read-only MCP server. Or stay in the sheet and add a second workflow that reads it and posts a summary to Slack or email every Monday morning. That closes the loop: data lands automatically, and the report writes itself. For a deeper look at building scheduled reporting pipelines, my earlier writeup on the automated marketing reporting dashboard covers the GA4 and Search Console side of the same pattern, and the Outbrain to Google Sheets connector shows how the auth flow differs when the API forces short-lived tokens. The 3 automations every marketing team needs lists where reporting automation fits in the priority order.
If you want this running for your own affiliate programs without rebuilding it yourself, that is exactly the kind of marketing automation work I build for clients. I set up connectors like this one, wire the scheduling and alerting around them, and hand over a sheet your team can actually read. Start with a free automation audit to see which of your reporting routines are wasting hours, and get in touch when you are ready to automate them.