How to Connect Google Analytics 4 to Google Sheets With n8n
Pull GA4 data into Google Sheets with a self-hosted n8n workflow: exact runReport JSON, offset pagination, and the quota guard. Live in about an hour.

Edward Chalupa
Founder, Whtnxt · Dallas, TX

Connect Google Analytics 4 to Google Sheets by calling the GA4 Data API from a self-hosted n8n workflow. No add-on and no connector subscription: one HTTP Request node, one code node, and a Sheets append. The build runs nightly and takes about an hour.
Every guide that ranks for “connect Google Analytics to Google Sheets” sells you one of two things. Either it pitches a paid connector like Supermetrics or Coupler.io, or it walks you through Google’s aging add-on with its manual refresh. This build owns the pull the same way I own the pull for affiliate stats in Google Sheets and call data from CallRail. It is the reporting-pipe architecture behind the n8n dashboards I deploy for clients.
What are you actually building?
A scheduled n8n workflow authenticates against the GA4 Data API with a service account. It pulls yesterday’s sessions broken down by date and channel, flattens the JSON response into one row per day per channel, and appends the rows to a Google Sheet. You end up with a running history: date, channel, sessions, users, key events, and revenue, refreshed every morning before anyone opens a laptop.
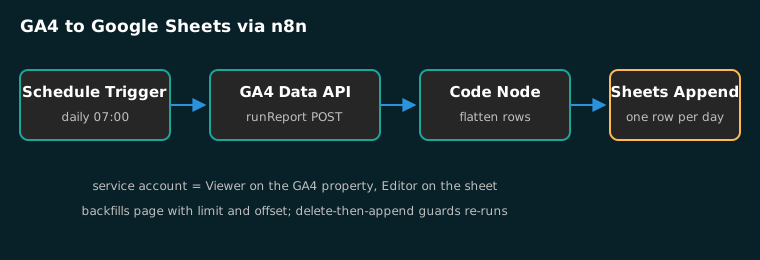
Two properties of the API decide the whole design, and the add-on guides skip both.
First, the GA4 Data API charges in tokens rather than requests. A standard property gets 200,000 Core tokens per day according to Google’s quota table, and most simple requests cost 10 or fewer. Second, one runReport response returns at most 10,000 rows, the limit stated in the runReport method reference. A year of daily data by landing page needs pagination to come out whole.
A nightly pull of yesterday’s traffic burns a fraction of the daily token budget. That headroom is what makes a multi-account roster feasible on a single n8n instance: the budget is per property, so each added client brings its own allowance. Connector subscriptions exist to solve a problem the API does not actually create for a small agency.
What do you need before you start?
| Item | Details | Time |
|---|---|---|
| GA4 property | Viewer access at property level | Done already |
| Property ID | Admin > Property > Property details | 1 minute |
| Google Cloud project | With Analytics Data API enabled | 10 minutes |
| Service account | Plus a JSON key file | 5 minutes |
| n8n instance | Self-hosted or cloud | 20 minutes if new |
| Google Sheet | One tab, headers in row 1 | 2 minutes |
| Google Sheets credential | The same service account, shared as Editor | 5 minutes |
Total: about 90 minutes from zero, under an hour if n8n already holds a working Google credential. If you have never touched n8n, read my n8n marketing automation engine setup first. If you have never made a service account, the Adtraction-to-Sheets guide walks the same key-file flow for a different API.
Step 1: How do you set up the service account?
Create a Google Cloud project (or reuse one), then enable the “Google Analytics Data API” under APIs and services. Create a service account under IAM & Admin with no role at the project level. The GA4 property, not the project, is what grants read access to your data.
Download the JSON key and paste it into a new Service Account credential in n8n. Then open GA4, go to Admin > Property Access Management, and add the service account’s email address as a Viewer. Skip this step and every request comes back PERMISSION_DENIED, which is the single most common failure I see in this build.
Finally, share the destination Google Sheet with the same service account email as Editor. I scope the service account to just this sheet rather than the whole Drive, the same least-privilege rule I use in the CallRail pull.
Step 2: How do you configure the HTTP Request node?
Add an HTTP Request node with these settings:
- Method:
POST - URL:
https://analyticsdata.googleapis.com/v1beta/properties/PROPERTY_ID:runReport(replace PROPERTY_ID with the digits only, noproperties/prefix) - Authentication: the Service Account credential from step 1, via Predefined Credential Type
- Send Headers:
Content-Type: application/json - Send Body: JSON, with the body below
The request body pulls yesterday, split by session default channel group:
{
  "dateRanges": [{ "startDate": "yesterday", "endDate": "yesterday" }],
  "dimensions": [
    { "name": "date" },
    { "name": "sessionDefaultChannelGroup" }
  ],
  "metrics": [
    { "name": "sessions" },
    { "name": "activeUsers" },
    { "name": "keyEvents" },
    { "name": "totalAdRevenue" }
  ],
  "orderBys": [{ "dimension": { "dimensionName": "date" }, "desc": false }],
  "returnPropertyQuota": true
}
yesterday is a legal literal for the date range, so the node needs no date math. Setting returnPropertyQuota to true makes the response carry the property’s remaining token balance, which is how you prove the quota argument from the first section on your own account. If you build with a different date field than the one above, keep it consistent everywhere. My lead scoring build normalizes dates in a code node for the same reason: mixed formats are how nightly pulls silently double-count.
Step 3: How do you flatten the response into rows?
The response nests values awkwardly: dimensionValues and metricValues are arrays of objects, each holding a stringValue. A single-code-node transform turns them into flat rows. Add a Code node after the HTTP Request with this JavaScript:
const resp = $input.first().json;
return (resp.rows || []).map(r => {
  const row = {};
  (resp.dimensionHeaders || []).forEach((h, i) => {
    row[h.name] = r.dimensionValues[i].stringValue;
  });
  (resp.metricHeaders || []).forEach((h, i) => {
    row[h.name] = Number(r.metricValues[i].stringValue);
  });
  return { json: row };
});
The headers tell you the column names, so the code never hardcodes positions. Add a new metric to the request body and it lands as a new column automatically. This is the same defensive shape I use in the Outbrain reporting pulls: read the schema from the response instead of assuming it.
Step 4: How do you append rows to Google Sheets?
Add the Google Sheets node, set the operation to Append Row or Rows, and map the Code node’s output. Use the Service Account credential, select your spreadsheet, and map all incoming columns with the map input. Run the workflow once manually. Yesterday’s channel rows appear in the sheet within seconds.
One rule from the Outbrain-to-BigQuery build applies here verbatim: a re-run must not double-write. My idempotency rule for append-only stores is delete-then-append, so before any manual backfill I clear the rows for the date range the run will write. A normal nightly run only appends a date the sheet has never seen. The delete matters exactly on the mornings you re-run something, which is exactly when double rows do the most damage.
Step 5: How do you schedule it and handle pagination?
Set the Schedule Trigger to run at 07:00 your time. GA4 finishes processing the prior day well before then, so the pull always lands complete. The workflow is done here for daily summaries: yesterday by channel is dozens of rows, nowhere near a response limit.
Backfills are different, and this is where the 10,000-row response limit in the runReport reference actually bites. Twelve months of daily data by landing page is far past one response, so the pull must page:
- Add the
limitandoffsetfields to the request body. - Put the HTTP Request inside a Loop over Items, incrementing the offset by the page size on each pass.
- Stop the loop when a pass returns fewer rows than the page size.
A moderate page size keeps each response comfortably under the ceiling and keeps token cost predictable. The response also carries rowCount, the total available rows, so a backfill can compute its page count up front instead of discovering it mid-run.
How do you verify the pipeline works?
Run the workflow and check four things before trusting the sheet:
- Row count matches GA4. Open GA4 > Reports > Traffic > Acquisition, set the same date range, and compare the channel rows against the new sheet rows. Sessions per channel should match exactly.
- Quota is moving. The HTTP response’s
propertyQuotablock shows tokens consumed. A daily channel pull should consume 10 or fewer tokens per pass, against the 200,000 daily property budget in Google’s quota docs. - A re-run does not duplicate. Run the workflow twice for the same date, then check the sheet has one row per date and channel. If it has two, fix the delete-then-append guard before scheduling.
- Tomorrow’s rows arrive unattended. The real test is the next morning: rows appear with no manual run.
What breaks, and how do you fix it?
| Symptom | Cause | Fix |
|---|---|---|
| PERMISSION_DENIED | Service account not added to the GA4 property | Admin > Property Access Management > add it as Viewer |
| PERMISSION_DENIED on Sheets | Sheet not shared with the service account email | Share as Editor, exact address from the key file |
| Empty rows, no error | Property ID wrong, or date range before data exists | Digits only in the URL, check the property’s first event date |
| Metric values are 0 | Metric needs a custom definition | Remove it, or define it in GA4 Admin first |
| RESOURCE_EXHAUSTED | Concurrent pulls exhausting the quota | Serialize runs; the quota page caps a property at 10 concurrent Core requests |
Google’s error responses reference maps these to the 403 and 429 HTTP codes. The rate limit is the one that surprises people who run one n8n instance across many properties. The cap that matters is concurrent requests, not daily volume. I serialize reporting pulls across the client roster so no two heavy reports hit the same property at once.
FAQ
Can I use the free GA4 add-on instead? Here is my position: for scheduled reporting, the add-on era of GA4-to-Sheets is over, and teams that treat it as infrastructure are one vacation away from a stale dashboard. The add-on can build a GA4 report in Sheets, and it is genuinely fine for a one-off snapshot. It cannot schedule without Google Apps Script triggers, and its filters are manual string formats. The n8n build costs one hour once and never needs you again.
Does this work for many properties? Yes, and it is the reason I built it this way. One service account added as Viewer to each property, one workflow per property, all appending to tabs of one sheet. The token budget is per property, so a roster scales without quota pressure. Compare that math against the seat pricing on the pricing page before committing to a connector subscription.
Can I pull a full year on the first run? Yes, with the pagination loop from step 5. I backfill new client properties a year at a time before their reporting dashboard goes live, and the AI marketing automation builds start from exactly this pull.
What about BigQuery instead of Sheets? For a warehouse, the free daily export beats any API pull. The API path wins when the data lives in Sheets with the client, or when the pull feeds an n8n branch that acts on the numbers. Ad spend speaks the same language: the Google Ads to Sheets build runs the identical shape against the Google Ads API. The Outbrain-to-BigQuery guide covers the warehouse variant.
If reporting like this should be running without you, the automation audit scores where your data still moves by copy-paste. The same pulls power the lead reporting on the lead generation service page, and the marketing automation service page covers what managed builds include.